
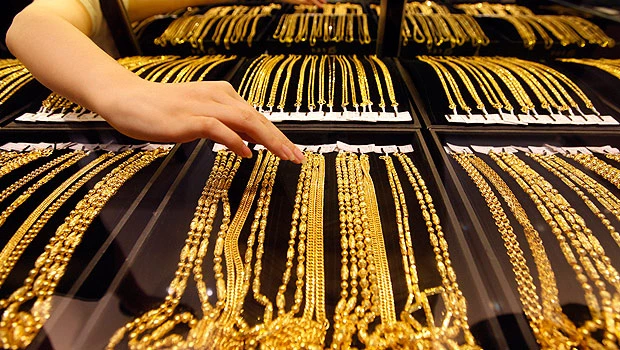
- It has been a year of records for gold this year.
- Its price has hit multiple record highs and the upward pressure continues to push the yellow metal higher.
Gold, like other commodities tends to exhibit long trend cycles.
For example, it rose from $50 to a high of $500 per ounce between 1970 and 1980.
It then fell sharply and bounced along around $200 for the next 20 years before starting its current uptrend.
This is important to note. Even if gold has been in a current uptrend for the best part of 11 years, history tells us that trends in gold can persist for longer than this.
Why is the current environment so conducive to a higher gold price?
The West has been on a debt binge for the last 10 years. It was debt-induced bubbles that caused the housing bust in the US in 2007/2008 and public-sector binges that wreaked havoc on Greece’s financial dynamics. Now the bills are coming due. The US has already lost its AAA credit rating and is now embarking on a $2 trillion austerity program to reduce the US’s enormous debt overhang. However, even with this effort debt-to-GDP is expected to rise to nearly 100 percent in 2011 in the US and 80 percent in the UK and France.
But why does this draw investors to gold? Paying down debt means people and governments won’t be spending as much and so it follows that growth will fall. Some of the largest investment banks including Morgan Stanley have reduced their growth forecasts for this year. Morgan Stanley analysts now predict that global growth will expand by 3.9 percent this year, down from its 4.2 percent original forecast. A weak growth environment is usually bad for stocks and can cause interest rates to fall. When yields are low — both bond yields and equity dividend yields — investors are attracted to gold. The precious metal doesn’t yield anything, but it holds its value during periods of economic turmoil or weak growth.
This is why gold has been moving inversely with the size of the US Federal Reserve’s balance sheet. As it has embarked on a double dose of quantitative easing (QE) the Fed has been accused of debasing its currency. QE is essentially the Fed flooding the market full of dollars to try and get people to spend. When supply of dollars outstrips demand the price of something tends to fall, indeed the dollar index, which is the dollar measured against a basket of its largest trading partners’ currencies, has fallen 10 percent this year. When the world’s reserve currency is falling at this type of annual pace investors look elsewhere for value, and what better than the world’s most famous store of value — gold. At the same time as the dollar has fallen 10 percent, gold is up by a whopping 50 percent. Going forward, if there is further QE we may be in unchartered territory both for gold and for the dollar
Europe’s problems are far-reaching. The entire structure of the monetary union is being questioned and for some the only credible solution is fiscal union, however there is much resistance to closer fiscal ties with the bloc’s largest economy Germany against the idea of joint debt issuance or writing down the debt levels of some of Europe’s weakest economies.
In fact a growing number of influential thinkers believe that the euro zone may need to shrink before it can survive, eventually becoming a union of primarily northern, richer euro zone states with strong fiscal dynamics. The euro may be the world’s second most traded currency but its future survival is now in question.
Since gold isn’t controlled by a single government and it can’t be printed by a central bank, which is a potent mix in the current economic climate.
It’s easy to think that gold’s performance this year is all down to the US Federal Reserve or worries about the future of the euro, but it is also down to traditional price drivers — supply and demand fundamentals. Gold takes a long time to extract from the earth, it is expensive and there is not that much of it so supply is tight. On the other hand demand is growing. According to the International Monetary Fund (IMF) central banks’ gold purchases were up 168 percent in 2010 relative to 2009, this equates to 203.5 metric tons, equivalent to 15 percent of total production.
The biggest central bank gold bugs were from emerging markets with Mexico, Russia, Thailand and South Korea making large purchases. Indicators also point to a continuation of central banks’ buying gold this year.
Added to this retail demand for gold is also increasing.
Traditionally, gold is a gift given at weddings in India and at Chinese New Year.
The burgeoning middle classes in these emerging market behemoths are also having a larger impact on demand for gold worldwide.
And retail demand is not only coming from the emerging markets. Gold Exchange-Traded-Funds (ETFs) are encroaching on the S&P as the most capitalized ETF according to market value, which suggests that demand for gold is fairly broad-based.
But what about the future?
Gold has been called a bubble for years; however, so far it hasn’t popped in any meaningful way.
This doesn’t mean that it is going up in a straight line and there can be daily fluctuations. Fundamental factors in the near-term that could hurt gold’s rise will depend on the Federal Reserve.
If there is a further round of quantitative easing in the US then investors may react by diversifying out of the dollar, which may benefit gold.
Added to this, if there are further strains in the euro zone, this could also cause investors to diversify out of a major currency and into precious metals.
However, some of the world’s largest investors including George Soros have said they are reducing their gold exposure at these high levels and we would expect a lot of profit taking in the coming days, weeks and months.
When trading gold in the short-term it is important to look at the technical picture.
Gold is currently above its weekly, daily and even hourly moving averages, which suggests it is in overbought territory. Indeed, directional trend indicators like the relative strength index (RSI) and MACD are also in over-bought territory. However, the price keeps powering ahead toward $1,900, however, in such overbought territory we urge caution.
Support stays at $1,850 — the pivot point and key technical indicator — below here is $1,795. $1,910 is an immediate resistance level.